DCF model tutorial with free Excel
A DCF valuation is a valuation method where future cash flows are discounted to present value. The valuation approach is widely used within the investment banking and private equity industry. Read more about the DCF model here (underlying assumptions, framework, literature etc). On this page we will focus on the fun part, the modeling!
Step by step DCF Valuation tutorial
In these coming 8 steps, you will be able to perform your own DCF Analysis. This DCF model is simplified in order to teach you the basics of a DCF valuation.
USE CODE: BVAL100 for 100% discount.
Expand each section to follow the (free!) DCF-model tutorial. Now lets do some modeling!
Sneak peek of the DCF valuation (click to enlarge screenshots)
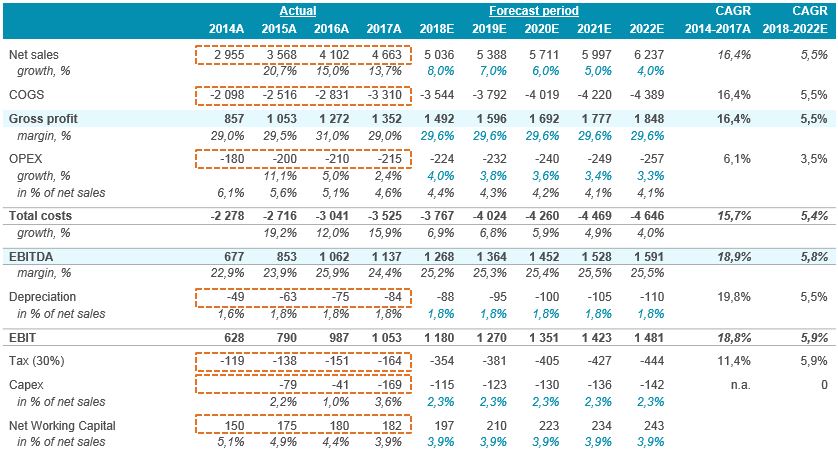
Enter the historical information of the company you wish to perform a DCF valuation of (in the DCF sheet). The information can be found in the company’s annual report or other sources such as; management presentation, information memorandum, business reviews etc. In our example our historical year’s are 2014 – 2017A. “A” stands for Actual and “E” stands for Estimate.
To change your historical Financial Years, go to the Input sheet.
Steps
- Enter values for the historical years for 2014A-2017A; Net sales, Cost of Goods Sold “COGS”, Operating Expensenses “OPEX” and Depreciation for each year. All formulas will give you Gross Profit, Total Costs, EBITDA and EBIT.
- Enter the tax cost for the historical period “Tax”. This does not always amount to the corporate income tax (30%), since companies from time to time have deductions for several reasons (tax assets arised from losses on previous years etc.)
- Enter Capex (Capital Expenditure) which is the annual investments for the company each year. This is normally specified in the Annual Report under Cash Flow Statement or in a specific note. If you cannot find the information in the Annual Report, you can do some math, and take the difference from two years tangible assets and adjust for depreciation. For example, if the company had tangible assets of “100” in year 2016 and “120” in 2017, and it had depreciation of 10 for 2017. The company had CAPEX of “30” 2017.
- Enter Net Working Capital (“NWC”) for each year. This is also normally specified in the annual report. If not;
- Add Account receivables + Inventory and Prepaid expenses and other: This information will sum up to Total Current Assets
- Subtract: Account payable+ Accrued Liabilities and Current Liabilities: This will sum up Total Current Liabilities
- The Net Working Capital is calculated as Total Current Assets – Total Current Liabilities = NWC. A positive NWC is normal, but it is not uncommon also with a negative NWC.
The historical information will be used to make forecasts in the forecast period, to have something to compare with and base the forecasts upon. It is also great to use for the Output of the valuation.
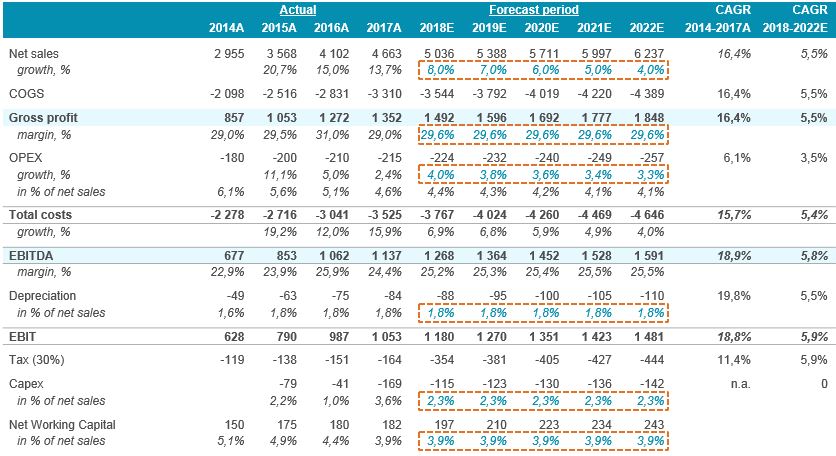
The projections in the DCF model have large impact on the valuation, therefore, this step is extremely important. We will now use the historical information as a base in order to make good and likely projections of the future.
In the picture below we have highlighted the information you should fill in. However read the instructions below the picture before you make your assumptions and input.
Steps
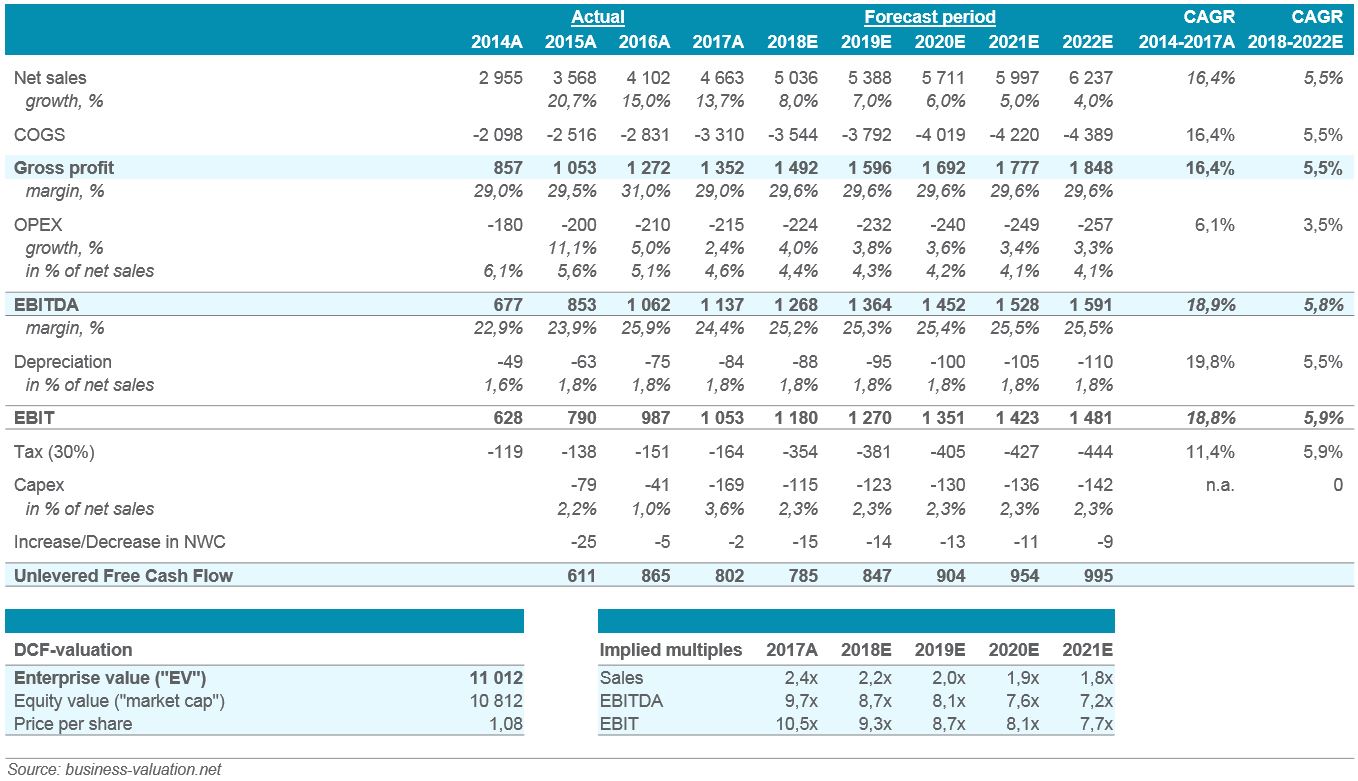
- Net sales – Make projections of net sales by looking at historical values – In this example the business has had an annual organic growth between 14% and 21% with a CAGR of 16%. This is normally a good measure for future estimates. However, “we have spoken” to the management of this company and they have a financial target of 6.200 in 2022E, and therefore we have adjusted the forecast to reach this level. Spend a lot of time with doing a good net sales forecast, normally you can use a more detailed level than just simple net sales (price per kg, volume development, inflation etc. are keywords for your unique valuation)
- Gross profit – look at historical values. This company has had gross margins in the range of 29 – 31% in the past few years. In our example we have chosen to use an average value of the historical information, in the forecast period, implying 29.6%. This is key, if your company is selling products… But of course it varies from business to business. In some cases it can be easier to estimate EBITDA-margins instead of Gross-margins.
- OPEX – Make projections of the company’s operating expensens. It varies from business to business. Does your business benefit from economies of scale? Or does it not… This will affect your assumptions. Our estimates are based upon economies of scale, and OPEX will pnly grow with a modest level in the forecast period. Keywords to consider (selling and marketing, production employees, real estate, facilties, R&D etc.)
- Depreciation – look at historical depreciation in relation to sales and use an average from these years to use in the projection period. In this case, it was quite simple, we used 1.8% of sales. When a company is planning a lot of CAPEX, you might need to do your own depreciation scheme…
- Corporate income tax – use either the historical tax level or the corporate business tax applied in your country. We have used 30% in this example. This input is done in the Input Sheet.
- CAPEX – Determine capital expenditures that you believe the company will have in the future. This is quite difficult to estimate, therefore you can use an average of the last five years in relation to sales.
Important: This section is for you who have access to a financial database such as Bloomberg, Reuters, FactSet or similar and know how to do trading comps. If you do not have such access, you can type in 30% into Debt to Total Capitalization and 70% intoEquity to Total Capitalization. Cells D7 and D8 in the WACC assumptions sheet! This is the most frequent used assumption when determining capital structure in a DCF model.
Or simply use a fixed WACC! If you work with a fixed WACC, then you can jump to Step 4. But remember to type the WACC into cell D23 in the WACC sheet.
However, the below described method is more accurate and preferred if you have all the needed tools.
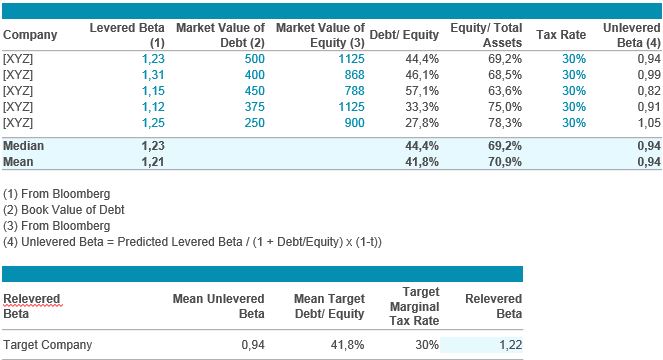
The picture describes the input we have made in our example valuation, which is further described below the picture.
Assumptions and input
- Identify a couple of listed companies that are similar to the one that you perform the DCF valuation of
- Enter the listed companies beta which can be found in a financial data base such as Bloomberg
- Enter the Market Value of debt of these companies. The market value of debt is the same as book value of debt
- Enter the market cap for the traded peers
- Enter the marginal tax rate
- All this information can be found in the data base. Now the model will calculate the Beta and unlevered and levered Beta and put as input in the valuation model. This will affect cells D8, D9 and D14 in the WACC sheet.
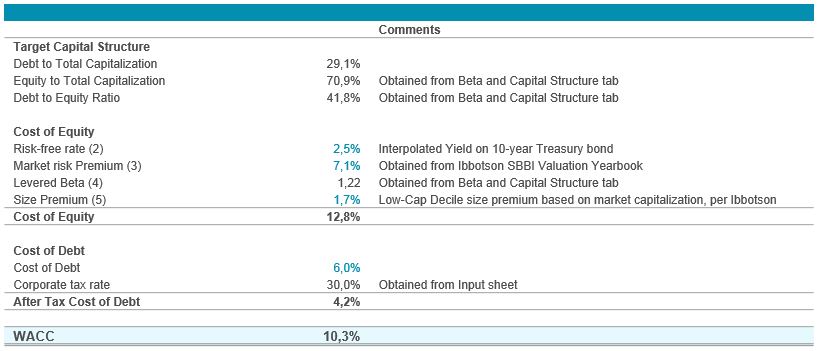
The capital structure is given from the previous step and works as a base for determining WACC in the calculation below. If you want to go fast-track here… Simply use a fixed WACC and enter this into cell D23 in the WACC sheet. Nowdays 8.0% is widely used, but depends on the size of the company, the industry it works in, risk profile etc. If you are still in school… Your teacher won’t allow a fixed value here, without the underlying assumptions. However, a hard copied value, normally “flies” in the reality since WACC is very “theoretical”.
Assumptions for WACC
- Enter the risk free rate. This is the same rate as the 10-year treasury bond and can most likely be found on your countrys government’s website, or by google e.g. “10 year interest rate in US”
- Enter the market risk premium – this is used to adjust for specific company risks and should be 7.1% according to: Ibbotson. This change yearly so google your source.
- The Levered Beta is given from previous excercise (Step 3)
- Now add a size premium according to Ibbotson as well. We have used 1.7% since our company is pretty small
- Now enter cost of debt, the rate which your company can borrow money at. If you are not sure, you can calculate the rate by dividing interest paid during the last financial year with total debt
- The corporate tax rate has been given from previous steps (Input sheet).
Next step is to calculate the present value of the generated cash flows in the projection period.
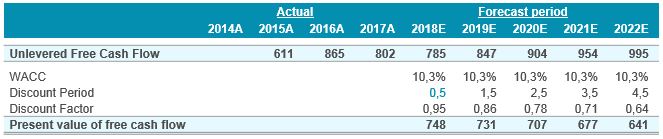
Steps
- Make sure the WACC is correct according to step 4
- The Discount Period is set according to the mid year method and could be leaved as is since the cash flow is evenly generated through the year
- The Discount Factor is calculated with WACC and the chosen Discount Period
- The present value of the free cash flow is now automatically generated
(YES!, you did not have to do anything at all in this step….)
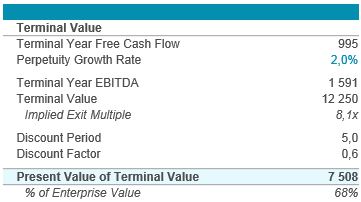
The Terminal Value (“TV”) has the largest impact on the valuation and it is extremely important that this input is correctly made.
Most values are already given as can be seen below:
Steps
- Perpetuity growth rate is the rate at which the economy is expected to grow at, this is normally around 2-3% in most well developed countries. It should be equal to the long term inflation rate target.
- Make sure the Implied Exit Multiple isn’t too high, since that probably means your assumptions are too aggressive in the Terminal Year. Another sanity check is to see whether the terminal value is higher than 70% of the Enterprise Value, then it is likely that something is wrong with your assumptions (they can simply be too agressive, or your company is in an early stage in its life cycle). Try to keep the Terminal Value <70%.
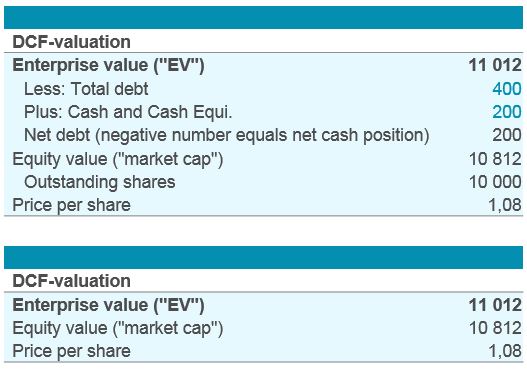
The DCF valuation is almost done, you have made all the inputs required and the Enterprise Value is already calculated. Now we will try to describe the results.
Below are the results in our valuation example:
Comments
In the results above you can see the Enterprise Value. You should also enter debt, cash and outstanding shares to get additional information on your valuation.
Valuation Range
It is now time to decide the valuation range for the company. In the example valuation we decide the range by changing WACC with +-1% up and one percent down, which gives a valuation range between approximately 9.800 – 12.500 with a mid value of 11.000.
This will encourage me to continue to develop the best Excel models and will take very little of your time…
 I will do my best to help you quick
I will gladly help you with any question you might have. Either comment below the relevant content or send me an email or use my contact form which can be found here.
Specialities: Business valuations, Excel models, Business development, Investment Banking, Buyouts, Divestments, Share issues, IPOs, Management Buyouts, Leveraged Buyouts.
Have a great day! (thanks for sharing my website which helps my content beeing available to more users)


When deriving unlevered FCF in historial financial data part, why doesn’t the item of “Tax” taking the deduction effect into consideration, i.e. calculate the theoretical taxes the company would have to pay if it didn’t have a tax shield?
Joseph, thanks for your good question. It is actually included, since its the Unlevered Free Cash Flow that is used for the Terminal Value. Please let me know if you have further questions.
Hi,
thank you for the great tools and guide.
I am trying to valuate Alphabet Inc., however the output is extremely unreal. I think my assumptions are ok, but if im changing them a little, the output doestn change.
My question would be, if this tool is ok for mega market cap companies or is there a limit and also is there a limit in the growth rate?
The tool can be used on any company, with slight case by case adjustments. For really large companies, they cannot grow at high speed in eternity, because then they get bigger than the economy itself. Its hard to see and understand exactly with what you mean. Happy to have a look if you sent over the Excel.
Dear Sir,
I need to know COGS&OPEX in the Enter historical financial information in the DCF valuation. Is cogs just sales expenses? Can you give me an example?
Regards
Thanks for using this dcf model!
COGS is Cost of Goods Sold. If we simplify it, a company selling goods has the following structure of the P&L;
+ Sales
– COGS (cost of goods sold)
= Gross Profit
– OPEX (Operating Expenses)
=> EBIT
So in your case, COGS should include all costs that the company has to produce a product that it has sold. If the company is selling services, then the P&L will look slightly different, and COGS not as important.
Hope this helps, if not please ask again.
Hi there, thank you for this model – it made my life so much easier in understanding and application.
I do however have a few questions not covered in your discussion/explanation section:
1. EBIT – this should be adjusted for all non cash and once-off entries, correct?
2. What exactly is included in debt? If valuing a company in a group, would the intercompany loans fall part of debt? Would the finance lease obligations fall part of debt?
3. What do you suggest I do for a company that is not listed in one region, but I find the Beta and D/E information of other companies in different regions, could I use that information and adjust my Beta for my region eg: adjust for exchange rate difference, for difference in economic climates, risk in the target company’s economy being higher etc. Could I adjust beta by 500basis points?
Thank you for this once again
thanks for visiting business-valuation.net. I will try to reply to all of your questions.
1) Yes, you should adjust for all one-offs.
2) You should include items in net debt, that is interest bearing. Inter-company loans, could possibly be considered if they are of “interest bearing character”. Would it be debt, if not owned by this inter group company, would it need to be replaced by bank loan?? If so, it is definitely debt. If the reason for intercompany loan is just to lower tax, then it should perhaps not be included. You have to look at it case by case.
3) You can have a look at the following two pages for information of regions and Beta: http://pages.stern.nyu.edu/~adamodar/New_Home_Page/datafile/ctryprem.html and http://pages.stern.nyu.edu/~adamodar/New_Home_Page/datafile/Betas.html.
Good luck!
Hello,
Thank you for you for this excellent spreadsheet.
I have a few questions:
1/ I try to value a $100 million US company. For such a small cap, is it possible to forecast an increase in NWC every year (+2% as a percentage of sales)? That allows my terminal value as a % of enterprise value to decrease.
2/ Is 74% correct as a % of enterprise value or it needs to be under 70%? I try to be as much conservative as I can but can’t find a reasonable way to be under 70%…
3/ According to Aswath Damodoran’s website, the current equity risk premium stands at 4.78% (adjusted payout) or 5.18% (cash yield). Are you sure the current ERP is still around 7% as in your model?
4/ I don’t understand what the discount period is, should I keep it at 0.5 in the first year forecasted?
Thank you,
Best regards,
Pierre-Alexandre Ravoire
Dear Pierre-Alexandre,
I will try to reply to your questions;
1) If a company is growing, NWC is almost always growing also. A normal way to approach this is to use NWC as a % of net sales. It makes sense that it reduces the Terminal Value, if the company is growing into perpetuity.
2) If you mean Terminal value is 74% of total value… I personally do not like when the Terminal Value is too high, but if you cannot get it lower, then it works with 74% also. One way to reduce the Terminal Value is to make the forecast period longer, from 5 to 10 years,
3) The equity premium changes several times per year, it is also depended on what market/country your company is active in etc. Aswath Damodaran knows what he is talking about… so I would definitely use the numbers you sourced from him (as long as you source the where you got the info from). Maybe this link can also help you: https://www.business-valuation.net/small-cap-premium/
4) It can either be 1 or 0.5 depending on the method you use. If you use 1… then it means you value the company from 1 of January year [XXXX] (starting year). In this model I have 0.5 because you do not get the cash flow at the end of the year, you get half of it in the first 6 months, and the rest on the last 6 months… It is called mid-year discounting and kind of makes sense if you think about it. Both methods work however!
Good luck!
Hello,
Thank you for your answer, that’s helpful.
The issue is that I don’t have much history on this stock, only 2 years of historic datas… So it’s a bit difficult to know if their NWC was too high last year or if is their normal. Using their current NWC the fair value decreases a bit but the terminal value increases to 80% from 74%…
Yes indeed more years of estimates would help but the model stops at five years of projected data. Plus, as far as I’m concerned the shorter the period of forecasts the better… 🙂
Best regards,
Pierre-Alexandre
If you do not have enough history of the company, then you can look at peers… For example; if all peers have 15% NWC / net sales… Then you can use that as an estimate, if the company is similar.
And regarding valuation approach, sometimes a DCF is not always the best solution! a simple multiple-valuation can of course also work. Read more about trading comps valuation here; https://www.business-valuation.net/methods/comparable-companies-analysis/
Thank you for putting together such a comprehensive spreadsheet. I have a few questions…
In your spreadsheet it seems you have EBIT= EBITDA + Depreciation. Isn’t that double counting the D&A? I thought EBIT + DA equals EBITDA. Shouldn’t EBIT simply be pulled directly from the 10k as “operating income”, then adding D&A to achieve EBITDA? Im confused. Furthermore, you instead derived EBITDA from Net Sales minus Total Costs. If I do that, then I get a totally different value versus simply adding EBIT (operating income) to D&A to achieve EBITDA. Can you clarify the reason behind why you did this? Thank you.
Dear Pat, I totally understand your question. The way the model is built is that all costs, are made as negative numbers in the input cells… Therefore EBIT + depreciation equals EBITDA, exactly as you have stated. But in the model we use net sales – total costs = EBITDA… and then to come to EBIT you deduct the depreciation. I think you will understand what I mean if you download the excel again, as it was before you made changes to it. Good luck!
Hi,
It was wonderful I found this site!. Thank you so much for the tutorial, it was amazing! I just would like to sk you, where can I get the information for step 5? I mean should I have an access to the paid terminal of Bloomberg or it is public?
Mariya
Yeah basically you need a paid terminal, software or similar. But I would suggest you use net debt / Ebitda of 3 times to get the leverage correct.
Hi, I enabled the option you told me about. And my number still off by a lot! Especially för Thé second sensitivity analysis
Hi again MM, good you solved the iterations part. Now you need also to change the numbers in W4 and T7 (W8 and T15 for the second one), to match the assumptions you did in your model. Basically in the top sensitivity analysis, use the your exact perpetuity growth rate and WACC that was used in the model. Good luck!
Hi, how do you exactly perform Sensitivity Analysis after coping the values of X and Y?
Thanks for your amazing work!
Hi MM, If you have done everything right, and still dont see any result, it may be so you have to activate iterations in your excel. It can be found under settings / options/ formulas and then click “activate iterative calculation”. Let me know if you did not get it to work.
Why interest has not been deducted from PBIT?
Srajal, Profit Before Interest and Tax does not include interest costs.
Thank you for this great template.
I noticed that the financial charges not listed in this example. Is this company don’t have these charges or I shouldn’t include it.
Regards,
Raed
Hi Raed, it depends really on the situation. If you are looking from a buyer-perspective (wanting to acquire the business) you will have your own financing anyhow, so normally you do value a business in a dcf model without interest costs. The leverage is reflected in the WACC where you have both equity and debt.
For Digital Media Distribution companies many times payments for rights to content and intellectual property rights are made in advance and subsequently amortised as they are consumed ie sold over the period. This amortisations constitute a major part of the cost of sales. The purchase of this rights is more like buying inventories. Typically amortisation are added back to determine EBITDA & Owner’s Discretionary Cash Flow. I think in this industry (Digital Media Distribution) such amortisation should be treated as inventory purchase and not added back as typically amortisation. Please what is your take and any guidance on this.
Uzoigwe,
Good question. If you must use a DCF model to value this business, then you shall use the exact cash flows for each year as they will appear. If you sell or buy someting year 1, this cash effect shall be seen year 1. A DCF model only takes into account free cash flow per year (over a period of years), then discounted back as of today. Amortisation only has a TAX-effect in this context (and in such way affects the FCF).
Fantastic work on this template. Great for educational use as well. I just had one question.
I understand that making all liability cells negative can make it easier to view the values as liabilities but when calculating net working capital, why do you minus the current year from the previous year. Should this not be the opposite?
For example, cell C22 is calculated as B56-C56. Perhaps you just forgot to include a negative sign?
Hi Blair and many thanks for your kind words.
The reason why you do this, is because you want to include the difference between the years, that actually consumes cash (if the working capital level increases in the company). In a growing business you sometimes need to increase the inventory level, and this consumes resources (cash converted into inventory). That is why you want to include the effect between the years in Net Working Capital (NWC).
I am including the following line items in my working capital calculation, but each year, cash goes up substantially and the net increase in working capital (assets-liabilities) gets so large that Unlevered FCF just keeps getting more and more negative as I go further out. Why is this happening?
TOTAL CURRENT ASSETS:
Cash
Accounts Receivable (Net of Allowances)
Platform Development Costs (Net of Accumulated)
Other Current Assets
Due from Affiliates
Member Loan Receivable
Employee Loans (Current)
Computer Software, FF&E and Leasehold Improvements (Net)
Employee Loans
Security Deposits
TOTAL CURRENT LIABILITIES:
Line of Credit
Loan Payable (Current)
Accounts Payable
Accrued Expenses
Loan Payable
Deferred Tax Liability
Deferred Revenue
Deposits Held
Total Current Liabilities
Hi John, cash should not be included into your working capital calculation. Working capital shall only include non interest bearing assets or liabilites.
I don’t understand working capital. You say that you shouldn’t include cash in the equation but the definition here: https://www.investopedia.com/terms/w/workingcapital.asp includes cash.
Hi Martin, you can include “cash” in your working capital that is used on a day-to-day basis, if you for example run a shop and have cash payments, then it probably required to have cash at hand. Typically you do not include cash in your working capital calculation, but there are always exceptions. As long as you know why you do it, and can properly explain why, then you should be okay. You can however never include a company’s net cash position in the calculation, it is not correct. Good luck!
If I may ask;
Why do you only take the next 5 years into account instead of making the periods indefinite?
Best regards,
Peter,
dutch student IBA
Hi Peter,
Thanks for your question.
By having a terminal year at the end of the forecast period, the period is what you call indefinite. What you could do is for example to add additional 5 years into the forecast, to make the forecast period even longer. But it is very difficult to predict what will happen ten years from now…
Great template and instructions. 2 questions, if you’re still responding….
1) I used this to value a UK small-cap however the sensitivity analysis would not update to the correct value. I tried reinserting Q12 and some other stuff but nothing seemed to work – so my sensitivity analysis tables have different (and wildly inaccurate) values. Any ideas?
2) What would be the best way to go about performing a valuation of a stock like Kering (KER.PA) a fashion house with a multitude of different brands (Gucci, McQueen, Saint Laurent) and associated revenues/ stores/ costs etc.
Best,
J
Hi James,
1) It is important for the sensitivity table to work that you have exact values from your model pasted into following cells: W4, T7, T15 and A12. For instance, if you have a different wacc than set in the table, it will show different values. If you have the exact numbers including decimals correct, and it still not shows the right values, then maybe you have deactivated tables to automatically update. If this is the case, let me know and I will try to guide you.
2) This is not an easy question. The stock price is of course the best measure, but if you want to do your own valuation, a SOTP (sum-of-the-parts-valuation) will of course be the best valuation approach. Combine this with a cash flow analysis and trading comps (and transactions), then you have a complete valuation set-up.
Good luck with your valuation!
okay makes sense…thank you! Also, for net change in WC, why is it that its decrease from 2006-07 when it seems like it increased from 155 to 300?
Have a question,
in your DCF model, why is your formula for “Net Working Capital” adding both current assets and liabilities, shouldnt it subtract? Please take a look. It is confusing. Thanks.
Hi Roger, thanks for asking. Total current liabilities, on row 53, is in my excel template negative – which means that in order to calculate net working capital I will have to add these two lines together (row 47 and row 53). Maybe it would be more natural to show current liabilities as positive numbers… I don’t remember why I did not do this (maybe to show that liabilities in fact is a liability and not an asset).
Thanks.
Again, can you do an article/write-up for this forum on how to value banks and financial institutions as well as oil and gas sector.
That could very well be something we could do in the future.
Thanks, your DCF Valuation analysis is very concise and explicit. Thanks once again.
However, I have some pertinent questions to ask.
a) Can this DCF model be used to value majorly commercial banks (or be used for other financial services firms too e.g Insurance)? Because i understand that Bank’s DCF valuation is peculiar because of the nature of their business model (regulation etc). Hence, if it can not,please shed more light on how to value banks using DCF.
b) The same question about valuing oil and gas companies.
c) When calculating the Terminal value, must the the two approaches (Perpetual Growth Method and the Exit Multiples) give the same value?
Thanks
Emerald,
Thanks for visiting my site!
a) For bank valuation or insurance you will have to use a different model than the one above, a specific bank valuation model such as: LINK: Bank (FIG) Modeling
b) For oil and gas valuation models you will have to look on this link named Oil and Gas Financial and Valuation Modeling
c) Absolutely not. If the values are in the same range, your assumptions are probably correct. If the values differ a lot, then you will have to go through why they differ so much. Probably some unrealistic assumptions, or maybe they do differ because they should. If that is the case, you will have to choose one of them and argue why one is better and more correct!
Why is cash not included in current assets?
Johnny Ice,
In the annual report and balance sheet, cash is not divided into “cash used as working capital” and excess cash. Some cash should however be added to working capital, depending on the business. What you can do is to use ~2% of sales and add this into current assets. But it depends on the business, some companies need more than 2% and some need much less (if any).
i would like to know how to calculate perpetuity growth rate when the forecasted cash flows are not always increasing and having highs and lows.
and what are these multiples exactly as in above its written implied exit multiple as 7x as i’am calculating enterprise value i need to know….can neone help me??
Raksha,
The perpetuity growth rate should be the growth rate of the economy where the company operates. If your dcf model is made for a company in the US, then you should use the growth rate of US economy (~2%)
It is just a multiple so that you can see if the assumptions you have made a reasonable. An exit multiple of >15x is not very likely, one below 3x is not very likely either. If you end up either above or below, some of your assumptions are probably either too optimistic or negative.
Thank you for getting back to me.
I failed to mention that what I did is change the actual years and forecasted period. I took out 2006 completely, and changed the years to 2009-2011. For the forecased period, I changed the years to 2012-2016.
This is basically to bring it uptodate.
But we’ll use your original file as to not confuse both of us.
1. So from your post I understand that Present value of Free Cash Flow (Q4) is the present value of the firm for year 2009.
2. And Terminal Value (Q7) is the theoretical value of the business in year end 2014.
3. What does the Enterprise Value (Q12) reflect? I thought that this reflects the value of the business in year end 2014, no?
4. Q19 is implied share price. Times it by 10,000 shares gives us $5740, which is the Implied Equity Value. You’re saying this is what I should look at to see what the business will be worth by the end of 2014?
I’m sorry I’m a little confused by different values. I’m just trying to find what the business is worth in the present time and future time at the end of the forecasted period. This is to help me pitch to investors, give them the values and they would pay for what share of the company.
5. Also, what’s stopping us from adding projected numbers for 2015, 2016 etc and increasing the projected value of the business in the process?
Saken,
1. Cell Q4 is; present value of free cash flow. Not present value of the firm. Meaning, the value of future free cash flow as of “today”.
2. Yes regarding Q7. Q9 is then the discounted value of the terminal value, as of “today”. Which is then added into the enterprise value in Q12.
3. Enterpise value reflects the value of the business as of “today” including net debt. All future cash flows and the terminal value are discounted with wacc to represent the value of today.
4. Implied share price, Q19 is what every share is worth “today”. When you buy a share for this price, then you pay for/expect future cash flows, but with a discount. The reason why you discount is, simply put it, because you have to wait for the cash which also means uncertainty. If you were 100% sure of the future cash flows, then the discount would be less (meaning a lower wacc).
5. You can add more years in the forecast period, it will make the dcf model even better (less impact of the terminal value). Normally you use a ten year forecast period, but I only had five years in this model to keep it simple.
Dear BV Pro,
Thank you for letting me use this template. I did some calculations and I have a few questions. First two are:
1. Is Present value of Free Cash Flow in Cell Q5 a value of the business now in 2012?
2. Is Enterprise value in Cell Q12 a value of the business in 2016?
Is there a way to contact you besides leaving comment? ie email?
Saken,
No problem, my pleasure!
1 and 2) The valuation in this example is per 2009-12-31. You discount future cash flow into a value of “today”. In my example per 2009-12-31. The terminal value however is a theoretic value per 2014-12-31 in my example.
So Q19 is where you should look!
Let me know if you have further question, I am happy to answer these here as comments.
Will this template work for a start up company, without historicals? If I have projected sales, expenses, etc for the company. What would be your recommended way to approach this type of valuation?
Thank you
Brendan,
If you have projected sales, expenses etc. It could work… It also depends on what type of start-up, how large etc. But the future is very uncertain (especially in a start-up), therefore you need to increase WACC big time with e.g. a small-size premium. But it depends on the situation.
Sometimes the sales can be pretty easy to foresee – but sometimes it could be just wild guesses, often too optimistic which will result in a value that is way too high in the dcf model.
In a business valuation, you (always) need a DCF model in one way or another. I would probably try to do one, and also combine it with a trading comps valuation and a precedent transaction valuation. To estimate the value of a start-up is difficult.
To BV Pro,
If we are supposed to valuate and analyse the cash flow of a pharma business, would it be correct to assume that a straightforward DCF analysis is not applicable?
Would there be a better valuation model to use? I am not sure about the approach here because pharmas tend to have low revenues and high R&D costs?
From an investors point of view why would such a pharma stock be practically attractive?
Mou P,
I am not the right person to ask. It is difficult to foresee future cash flows of a pharma business. Therefore you also do see their stock prices going both up and down with high volatility. I believe many investor (at least some) see pharma business as a kind of lottery ticket, e.g. I have a 10% chance of a XXX% increase. If all fails, I will only lose XYY. But that also depends on the maturity of the pharma business, in which phase it is currently in, what projects it has on the table and so forth.
If I were to value a pharma business I would try, if I could, to do a dcf valuation, but I would not rely on it since it would probably be just guesses (not even the management knows the outcome of new potential projects)… I would definetely do a comparable company valuation but maybe also see how much money the company has spent on R&D historically.
Dear Sir,
No reply till now
Thanks in advance
It’s very useful.
Thanks for all efforts.
Regards.
Sir,
I have few questions
1.Why you didnt consider the Depreciation in the calculation of Unlevered Free Cash Flow.
2.in determination of Net Working Capital, do I have to add the Postdated Cheques recieved from customers to the Account receivables.
3.If I have debit or credit balances in Current assets / Liabilities from companies in the same group i.e within the same holding company, Do I have to consider these balances in calculation of Net Working Capital.
Regards,,,
Tom,
1) Depreciation is not a cash flow component and does not affect cash flow, it only reduces tax.
2 and 3) These questions are business specific question, to give you a correct judgment on these questions, I would have to verify the underlying components myself and understand in what specific situation these questions arises. It all depends on the business, case-by case, recurring or non recurring?
Regarding no 2. Yes it sounds like it should be added.
3). All working capital that is needed to run a business is working capital and should be included in the net working capital calculation. If you are valuing the Group, then you have a different P&L and balance sheet where internal transactions are eliminated (consolidated). The answer is both yes and no, it depends on what you want to accomplish, what company you want to value etc.
Many thanks fo your efforts.
I want to know can we add the value of the Fixed assets in this way to have the value of the company ????
Tom,
That is a different valuation approach and can be useful when you compare your cash flow valuation and other business valuation methods. The book value is the value of the company’s assets (intangible and fixed assets).
It is very useful.
I have a few questions to ask.
1. Can we use the company D/E ratio itself instead of industry D/E (based on your example, you used the industry D/E)?
2. For the terminal value, why do you add only 0.5 yrs for discount period (4.5 + 0.5), why not 1 yr?
Thank you very much.
Pear,
1. Yes you can use the company’s D/E ratio. It is sometimes more correct – it all depends on the situation. If the D/E ratio is reasonable, you should use the company D/E ratio. If the company has too much cash, or to much leverage you should use the industry ratio and adjust for this (otherwise the value of the company will either be too high or too low.). But remember, you need to argue for why you choose either method. Both ways are correct. It is not the financing of the company that is interesting in this part in the DCF valuation, it is what the business itself is worth – not its owners ability to finance the business. A potential acquirer may have a lot of cash which it easily could add to the business…
2. If you have decided to use the mid year discount method (which is correct), the company/owner is in control of the cash evenly troughout the year. Some cash is paid out in January and some in December, to mention one example. To adjust for this you use the mid-year disount period.
But when you calculate the terminal value, you “are in control” of the cash flow at the end of the period (in this DCF model, in the end of 2014). That is why 0.5 is added. 1.5 would be in the middle of 2015…
So for the Terminal value, you get all the cash at the end of the year (2014) and that is why you only add 0.5.
Let me know if you have further questions, good luck!
Roger, P.Kumar,
I have copied two interesting links on the question you have asked.
– http://www.editgrid.com/user/wikiwealth/FCFF_vs_FCFE_Valuation_Model
– http://www.numeraire.com/value_board/messages/78.html
Let me know if you need further examples to fully understand the difference.
Kumar wants to know whether to use the Free cashflow for Equity (fcfe) or the free cashflow to firm (fcff) model.
may i know do you assist with valuation for companies for academic purposes
Sure please comment on this website and I will do my best to help.
I want to know when to use fcff and Fcfe model.and what adjustment to regarding debt part in fcfe and fcff model
P.Kumar, I am not sure what you mean with your question. Could you please specify?
According to experience and standard business evaluation 4.5% should be carried forward to the Terminal Value (TV) and not the 5.5% which exceeds average growth rate assumptions. Kindly confirm. Thanks.
Sir/Madam:
in business valuation report Income Approach DCF re: Mid year factor applied sample below:
FY2010 FY2011 FY2012 FY2013 FY2014 TV
0.5% 1.5% 2.5% 3.5% 4.5% 5.5%
is it correct to assume that the 4.5% of FY2014 should be carried forward to TV rather than the 5.5% given by the evaluator? Kindly advise and confirm correctness of TV-5.5%. thanks.
HondoBat21, If I were to use the mid year discount method, I would use 5.0 in the terminal value as discount factor.
Dear Sir,
I need to know the Levered Beta and Unlevered Beta for Event Management industry. Kindly let me know if you know it.
Regards
Yash, have a look at this link for levered and unlevered betas: http://pages.stern.nyu.edu/~adamodar/New_Home_Page/datafile/Betas.html.
Look for your industry on Damodaran’s frequently updated website . If you cannot find an exact match, look for a similar industry or a broader industry in which the industry you are looking for is included.
Good luck!
What is the 2010- 2011 market risk premium number – you had it in this model at 7.1% according to: Ibbotson. Thanks
Walt,
This link could be useful: http://www.iese.edu/research/pdfs/DI-0920-E.pdf
Choose the market risk premium based on the region of the company wou wish to value.
DCF model very nicely explained.I also enjoyed reading Rosenbaum and Pearl.
D S Prasad
Faculty(Finance)
IBS,Hyderabad
India
Thanks for using this free discounted cash flow template
Question about calculating levered beta, the what happens when Equity market value is negative ? where do we get levered beta from. I tried with a company and yahoo was not even showing D/E, as E was negative. in this case, how should we get relevered beta ?
Then use the industry average or median D/E as a target capital structure.
Select a few similar companies (peers) and calculate their D/E ratio and apply this average ratio on your company if it seems relevant.